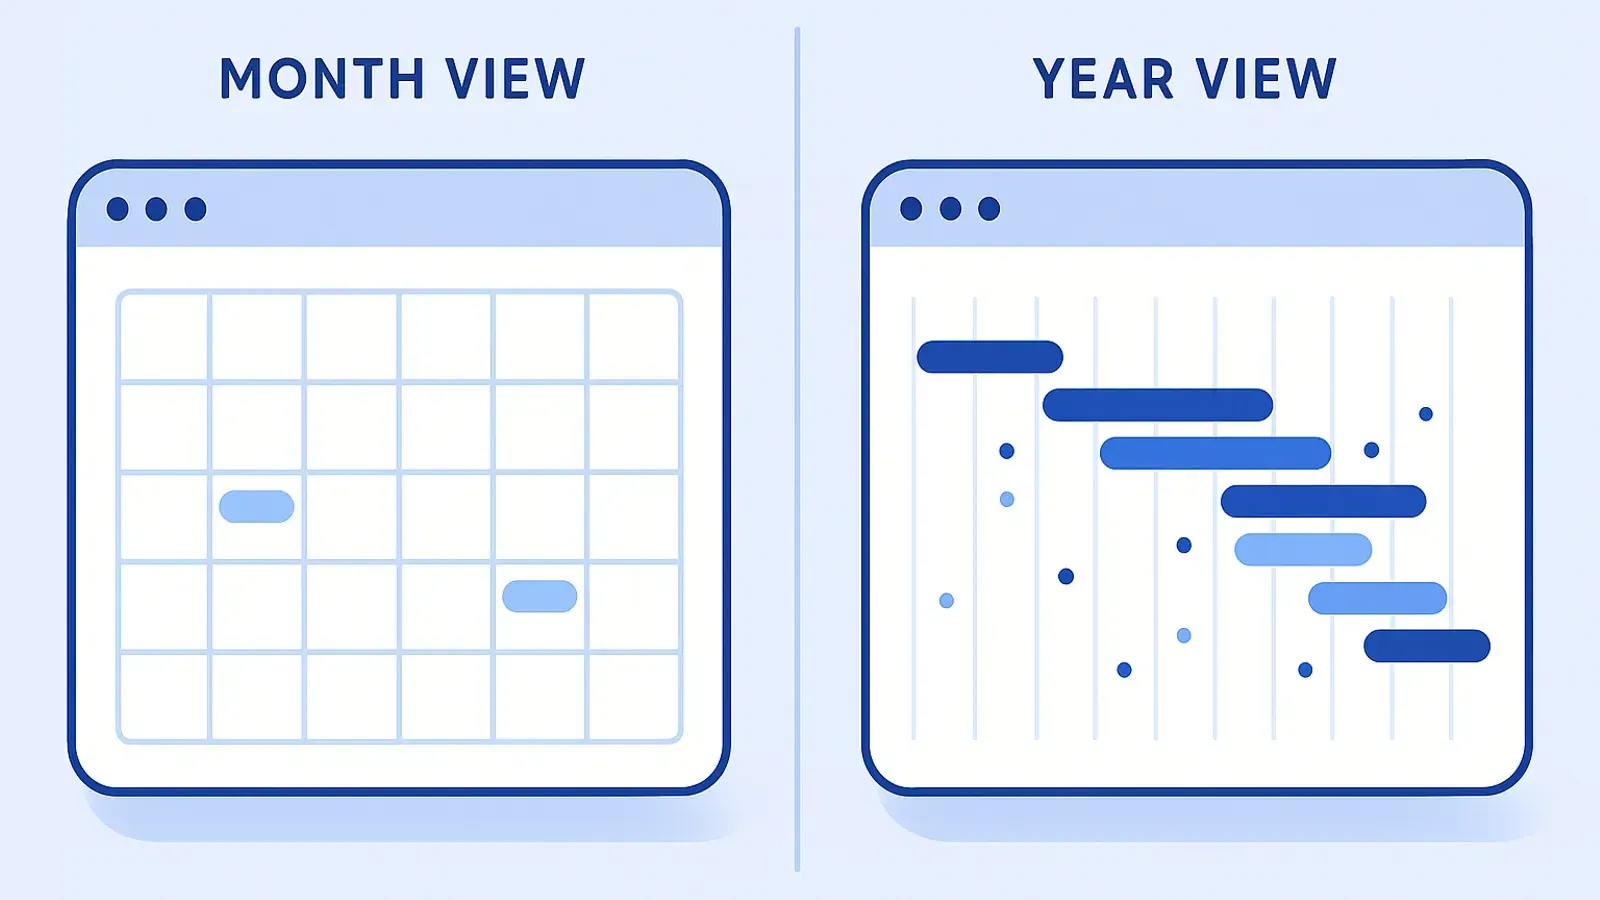
A 12-month calendar view shows your full year on one screen so deadlines, PTO, milestones and team commitments stay visible without scrolling. Unlike a month view that hides anything beyond 30 days, a year view exposes density: where the year is packed, where it is empty, and which weeks are still negotiable.
Most teams I work with plan a week ahead in their calendar and an entire year ahead in a spreadsheet. By July, the two never agree. The spreadsheet says “Q3 product launch” the same week the calendar shows three execs on PTO and the engineering team in a four-day offsite. Nobody saw it because nobody was looking at the whole year.
A 12-month calendar view is the simplest fix for that gap. One screen, twelve columns, every commitment plotted in time. It is not a new idea. Wall planners have existed for decades. What changed in 2026 is that you can finally render a year view on top of the calendar data your team already uses, instead of maintaining a separate plan that drifts out of sync within weeks.
This guide explains what a 12-month calendar view actually is, the five things only a year view exposes, how operators use it, and how to set one up on top of Google Calendar or Microsoft Outlook today.
What a 12-month calendar view actually is
A 12-month calendar view is a single visual surface that displays an entire year of commitments in one frame. The two dominant layouts in 2026 :
- Horizontal 12-column grid: months as columns, days as rows. Events render as colored chips that span their date range. Best for planning continuous initiatives (Q3 hiring wave, product launch ramp, a multi-month renovation).
- Stacked-month grid: 12 small monthly mini-calendars arranged in a 4×3 or 6×2 mosaic. Best for spotting standalone dates and clusters (PTO, public holidays, recurring rituals).
A 12-month view is not a long-scroll month list. Stacking 12 monthly views one above the other still forces vertical scrolling and breaks the single-glance comprehension. The discipline is : everything fits on one screen, at the cost of detail per event.
It is also not the same as a Gantt chart. A Gantt chart shows task dependencies and critical paths ; a 12-month calendar view shows commitments in clock time without modeling dependencies. The two coexist : Gantt for project mechanics, year view for human coordination.
The 5 things you only see on a year view
Density, collisions, white space, seasonality, cross-team overlap. None of these survive being broken across twelve monthly tabs.
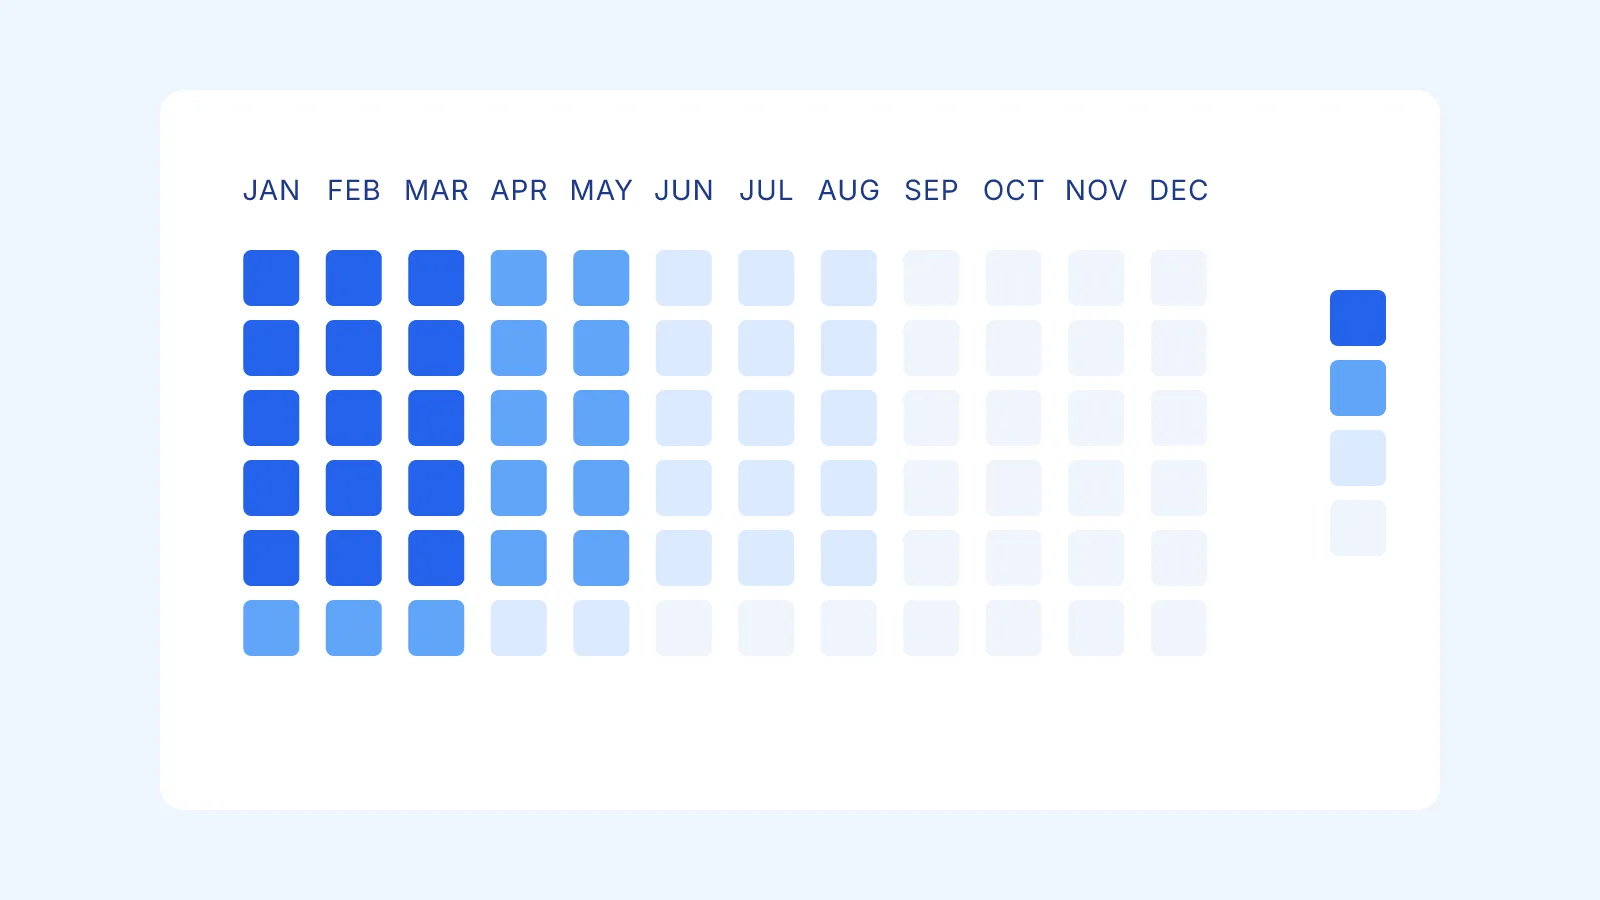
1. Density
Some weeks have three commitments stacked. Some months have one. In a month view you see today’s density. In a year view you see the shape of your year. Operators describe this as “the heat map I never had”. When you look at the year flat, the dense weeks become obvious before they become catastrophic.
2. Collisions across calendars
Marketing’s launch week is also engineering’s freeze week is also the CEO’s board offsite. Each calendar in isolation looks fine. Overlay all three on a year view and the collision is immediate. The whole point of overlaying multiple calendars on a year view is to make these collisions surface in seconds instead of in a postmortem.
3. White space
Empty months are not failures. They are capacity. February is the cheapest month to hire because everyone else is recovering from January. September is the worst month for ambitious launches because customers are returning from PTO. A year view tells you which months are open by showing you which months are not. You cannot plan capacity without seeing capacity.
4. Seasonal patterns
Run a year view for two consecutive years and the pattern emerges. Sales spikes in April and October. Engineering output dips the second week of August. Customer support volume doubles the first Monday of every month. Patterns that take a quarter to feel become visible in one glance once you have the data plotted in time.
5. Cross-team overlap
A year view is the only artifact where the founder’s PTO, the product team’s milestones, the sales kickoff, the hiring wave and the renewal cliff all sit on the same page. That is also the only artifact where you can ask “what week is everyone available” and get an answer in 5 seconds.
Why a 12-month view changes planning behavior
The argument for a 12-month calendar view is not aesthetic. It is behavioral.
Humans plan to the resolution of the view they look at. Show someone a week view, they plan a week. Show them a month view, they plan a month. Show them 12 months, they plan a year. The view is the forcing function.
This sounds tautological until you observe it in the wild. Rob Castaneda, founder of ServiceRocket, documented his shift from a weekly calendar to a year-at-a-glance view as the single change that moved his team from reactive to strategic planning. The view came first. The behavior followed.
The mechanism is cognitive bandwidth. A month view encourages you to negotiate next week. A year view encourages you to negotiate the year. Different scope of negotiation produces different scope of decision. Year-scope decisions (hiring waves, OKR seasoning, PTO rotations, product cadence) only get made when someone is staring at a year.
There is a second effect : commitment density becomes negotiable. When you can see that four high-stakes initiatives are stacked in Q3, you can move one to Q4 before the team is in the trenches. Without the view, the move only happens after the burn-out.
How operators actually use a year view
The patterns I see across teams in 2026 :
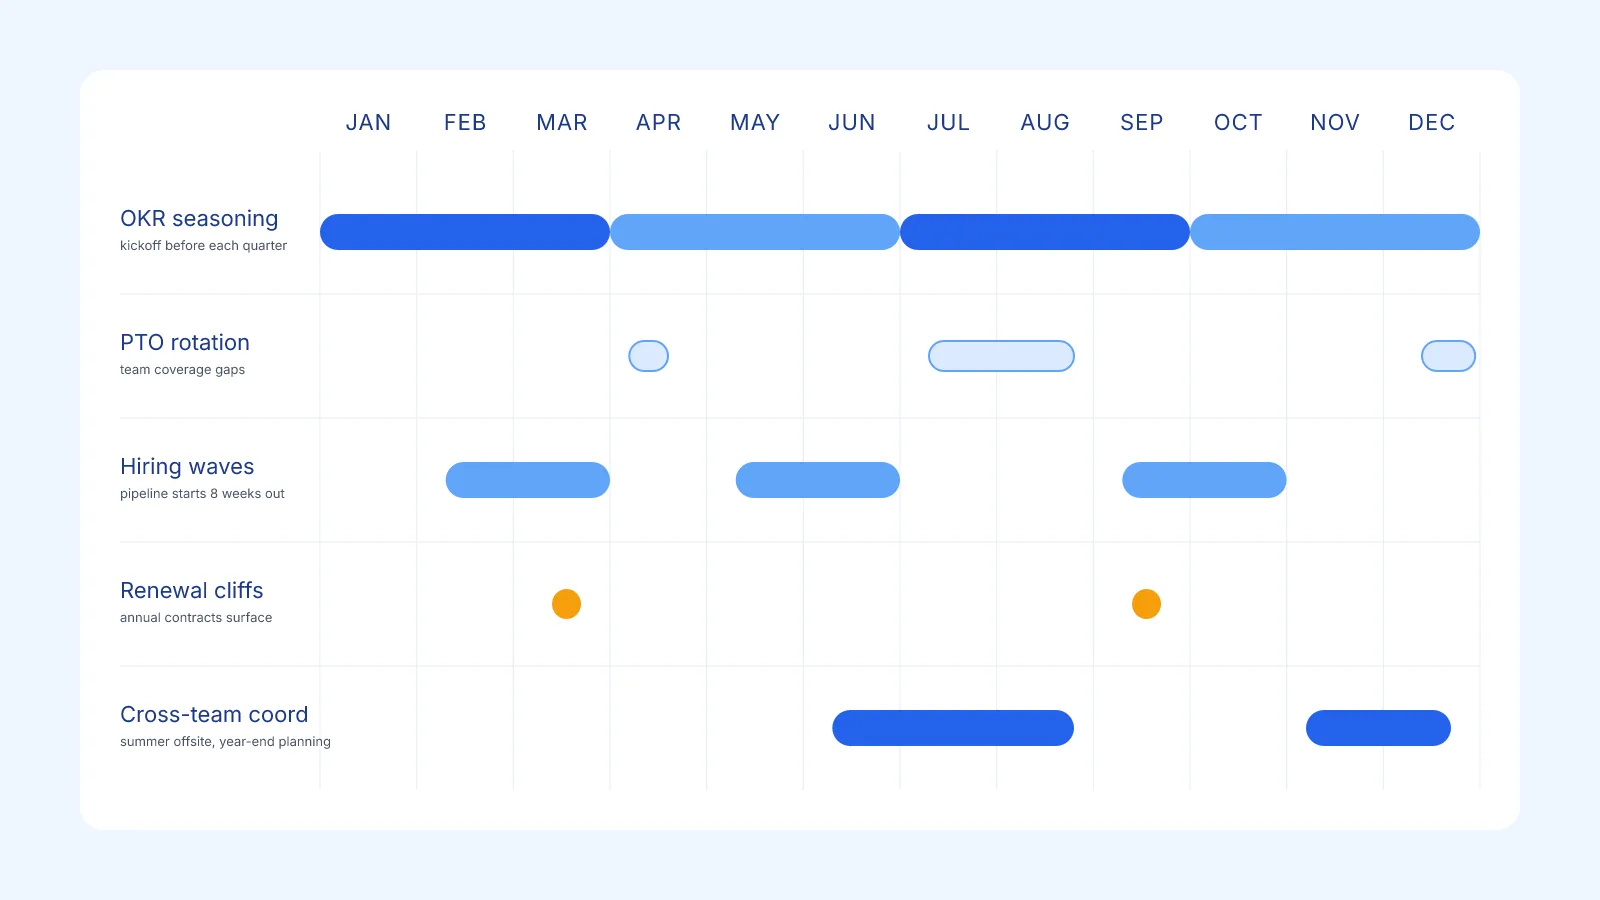
Quarterly OKR seasoning. OKRs are set per quarter but they need lead time. Operators use the year view to season Q3 OKRs starting in May (hiring kicked off, vendors locked, dependencies cleared). The year view makes the lead-time visible. Without it, OKRs ship as if the quarter starts on day 1.
PTO rotation. Teams with 5-10 people need PTO not to all stack in the same week. The year view overlay shows immediately whose PTO collides with whom and which weeks have zero coverage. Most teams I work with discovered they had two “zero-coverage” weeks per year that nobody had ever flagged.
Hiring waves. Hiring 4 engineers in Q3 means starting interviews in May. The view shows you the runway and prevents the “we need someone yesterday” panic in August.
Renewal cliffs. Annual contracts that renew in Q4 need attention in Q2. The year view surfaces the renewal cliff three months before it becomes a fire. Sales teams use this to staff Q4 around the renewal cycle, not around quotas.
Multi-stakeholder coordination. International Development Center of Japan (IDCJ) and similar consulting orgs run dozens of multi-month projects in parallel with shared resources. A year view is the only artifact where project managers, finance and the client-facing team can see resource collisions before booking the next engagement.
The common thread : every one of these workflows requires looking at the year flat. None of them work from a week view.
Setting up a 12-month calendar view today
You have three options in 2026, ordered by setup effort.
Option 1 : Native Google Calendar Year view
Google Calendar has a built-in Year view since 2021. Open Google Calendar, click the view selector top-right, pick Year.
What you get : a 12-mini-month mosaic, with dots indicating days that have events.
What you do not get :
- No event titles visible. You see that a day has events. You cannot see what those events are without clicking through to the day view.
- No drag-and-drop. You cannot move an event to another date from the year view.
- No filtering. All your visible calendars render the same way ; you cannot toggle layers (work / personal / team) inside the year view.
- No assignees, no event detail, no recurring-event preview.
The native Year view is a navigation aid, not a planning surface. For an honest breakdown of where it falls short, see our Google Calendar year view limitations page.
Option 2 : A year-view layer on top of your existing calendar
This is the option most operators end up on once they realize the native view is not enough. A year-view app reads your Google Calendar (or Microsoft Outlook) events via OAuth, renders them on an editable year grid, and writes any change you make on that grid back to the source calendar.
Kalnext is the option I built for this. It connects to your Google Calendar or Microsoft Outlook account (you can connect both at the same time), overlays multiple calendars on a single 12-month grid, supports drag-and-drop and resize directly on the year scale, layers tasks with importance and duration on top of events, and exports a printable A2 or A3 poster. The 14-day free trial does not ask for a card.
Other options exist. Fantastical is the most polished if your team lives on Apple. AnnuCal is a free entry point with three calendar tabs. Glance covers the basics on Google Calendar without team features. We compared seven of them, with criteria and pricing, in our 2026 yearly planners ranking.
Option 3 : Print a wall poster
Sometimes the most powerful 12-month view is the analog one. A 70cm-wide poster pinned next to the team’s desk has properties no app has : it is always on, never lost in tab purgatory, and visible to everyone who walks past. It is also slower to update, so it forces the team to commit before plotting.
Most year-view apps export PDF. Kalnext exports landscape A2 or A3 with your events baked in. Print quarterly, refresh the dense weeks before the quarter starts. Some teams print a fresh copy after each quarterly planning ritual ; others laminate and use dry-erase markers on top.
There is also a free printable calendar (blank, no signup) for anyone who wants to start with the analog version before deciding whether to layer software on top.
The yearly planning ritual that makes the view pay off
A year view without a ritual is wallpaper. The ritual that turns it into a planning surface :
Quarterly review (90 min, once per quarter). Open the year view. Walk through the next two quarters with the leadership team. Look at density, collisions, white space. Move what is movable. Decision quality on this call is 10x what you get from a weekly review because everyone is looking at the same surface and the same horizon.
Monthly groom (30 min, first Monday of the month). Open the year view. Confirm the upcoming month is locked. Re-balance the next 60 days if anything shifted. This is also the moment to add the PTO that surfaced in last week’s all-hands.
Weekly zoom-in (15 min, Monday morning). Drop into week view. Confirm the week against the year plan. Flag anything that drifted. The weekly cadence is not where decisions get made ; it is where execution gets confirmed against the plan.
The cadence works because each ritual operates at the right resolution. Year view for strategy, month view for sequencing, week view for execution. The view dictates the scope of the conversation.
Common mistakes when adopting a year view
Mistake 1 : treating it as a separate plan. The year view dies the day it disagrees with your calendar. Use a layer that syncs both ways, not a parallel spreadsheet you maintain by hand.
Mistake 2 : plotting everything. If every meeting goes on the year view, the view becomes noise. Year view is for commitments that lock weeks or months : OKRs, launches, PTO, hiring waves, board cycles. Day-to-day meetings stay on the week view.
Mistake 3 : not overlaying calendars. A year view of one calendar is half the value. The point is to see your team’s commitments alongside your own. If your tool does not support multi-account overlay, you are looking at a single lane of a multi-lane highway.
Mistake 4 : updating it once and forgetting. A year view that is six weeks stale is worse than no year view, because people trust it and act on stale data. The monthly groom ritual exists to keep it fresh.
Mistake 5 : skipping the print. A printed year view next to the desk is the lowest-tech, highest-ROI piece of office furniture. Apps are good ; apps plus a poster is better. The poster is what makes the year visible to people who do not open your app.
What’s next
Pick a horizon you actually want to plan, then pick the view that matches it. If you are not yet thinking 12 months ahead because your tool does not let you see 12 months ahead, the tool is the bottleneck.
If your team already lives on Google Calendar or Microsoft Outlook, the cheapest experiment is to layer a year view on top for two weeks and run one quarterly review on it. Try Kalnext free for 14 days, no credit card. Run one quarterly review on a 12-month grid and decide.